“” Is Not The Same As NULL

I have been very busy recently. Aside from Starcraft II, I picked up another side programming project. I am reworking an old MFC app and see how far I can bring it into modern age with MFC9.0.

MFC is horrible in practice because it forces you to deal all the details, such as resizing and redrawing. But it suits my purpose because it forces me to learn all the details.

As I was testing the application across Window XP and Window 7, I noticed a strange error. The Create() function of CAsyncSocket returns an error 10022 on Window 7, and not Window XP.

// pueudocode

// Create a server socket, CMyAsyncSocket is derived from CAsyncSocket.
m_serverSocket = new CMyAsyncSocket();
BOOL hasError = m_serverSocket->Create(
   m_listenPort, // some port number to bind to
   SOCK_STREAM,
   FD_READ | FD_WRITE | FD_OOB | FD_ACCEPT | FD_CONNECT | FD_CLOSE,
   "");
if(TRUE == hasError)
{
   int error = GetLastError();
   ... // report and print error
}
... // more code here

Error 10022 is WSAEINVAL, where it indicates that an invalid argument was supplied.

Instead of reading the error code, my cognitive bias convinced me that the above code is flawless since it worked in XP. I jumped through the hoops to change firewall settings, network card settings, and tried to blame everything but the source.

Eventually I went back and inspect the API again, and realized that the third and fourth arguments are already defaulted to the appropriate values.

// CAsyncSocket signature
BOOL Create(
   UINT nSocketPort = 0,
   int nSocketType = SOCK_STREAM,
   long lEvent = FD_READ | FD_WRITE | FD_OOB | FD_ACCEPT | FD_CONNECT | FD_CLOSE,
   LPCTSTR lpszSocketAddress = NULL
);

So I cleaned up the function call to Create().

//...

m_serverSocket->Create(
   m_listenPort, // some port number to bind to
   SOCK_STREAM);

//...

Apparently the application was setting lpszSocketAddress to “” instead of NULL, it is an invalid argument (as indicated by the MFC for ~5000 times before it penetrated my thick head).

With the appropriate argument, everything works.

Do Suspended or Blocked Threads Consume CPU Time?

The short answer is no. Suspended or blocked thread do not consume any CPU time.

Of course, I didn’t know that. This is just a journal on how I wasted a perfectly nice afternoon.

Earlier…

I searched the internet, and found a MSDN article on scheduling priorities.

The system assigns time slices in a round-robin fashion to all threads with the highest priority. If none of these threads are ready to run, the system assigns time slices in a round-robin fashion to all threads with the next highest priority. If a higher-priority thread becomes available to run, the system ceases to execute the lower-priority thread (without allowing it to finish using its time slice), and assigns a full time slice to the higher-priority thread.

To me, the above paragraph sounded like all threads, regardless of state, are assigned to some time slices based on priority. So I wrote some test code to gain some insight.

Below is a test program that runs four threads to calculate Pi (on my quad-core CPU), and 1000 real-time priority sleeper thread that runs Sleep(). If suspended threads use any CPU cycles, it will definitely slow down the Pi calculation.

#include <Windows.h>
#include <iostream>
#include <boost/thread.hpp>
#include <boost/cstdint.hpp>

using boost::bind;
using boost::thread;
using boost::mutex;
using boost::condition_variable;

void calculatePi()
{
	double retPi = 0;
	for (boost::uint64_t denom = 1; denom <= 30000000000; denom += 2)
	{
		if ((denom - 1) % 4)
			retPi -= (4.0 / denom);
		else
			retPi += (4.0 / denom);
	}
}

void sleepForever()
{
	Sleep(10000000);
}

int main()
{
	std::vector<thread> tv;
	std::vector<thread> stv;

	// 1000 real time priority thread that sleeps
	for(int i=0; i<1000; ++i)
	{
		thread s(bind(&sleepForever));
		SetPriorityClass(s.native_handle(), REALTIME_PRIORITY_CLASS);
		stv.push_back(std::move(s));
	}

	// four normal priority thread that calculates pi
	for(int i=0; i<4; ++i)
	{
		thread w(bind(&calculatePi));
		tv.push_back(std::move(w));
	}

	for(size_t i=0; i<tv.size(); ++i)
	{
		tv[i].join();
	}
	return 0;
}

The Result

There is absolutely no difference in performance when the test program runs 10, 100, or 1000 sleeper threads.

Using the concurrency profiler in VC10, it shows that threads in suspended state are never context-switched or woken up during its lifetime.

Last four threads calculates Pi, the the other threads are sleeping. Sleeping thread did not execute, and therefore did not consume any CPU cycles.

Then I ran into another MSDN documentation on context switches.

Until threads that are suspended or blocked become ready to run, the scheduler does not allocate any processor time to them, regardless of their priority.

Yup. I have verified that the documentation is accurate. 😥

STL Performance Comparison (round 2): VC9, VC10, STLPort


Last year, I did a performance comparison for VC7, VC9 (with and without SCL), and STLPort. Now that VC10 is out, I wonder if it is worth the upgrade.

So I dusted off the benchmark code from last year and upgraded the solution to VC10. This time, I would like to see how VC9, VC10, and STLPort 5.2.1.

VC8 and VC9’s Secure SCL “feature” was disastrous to many C++ programmers who cares about performance. So this test is done with Secure SCL disabled.

With all the C++0x language upgrades and performance claims in VC10, I expect improvements.

The Results

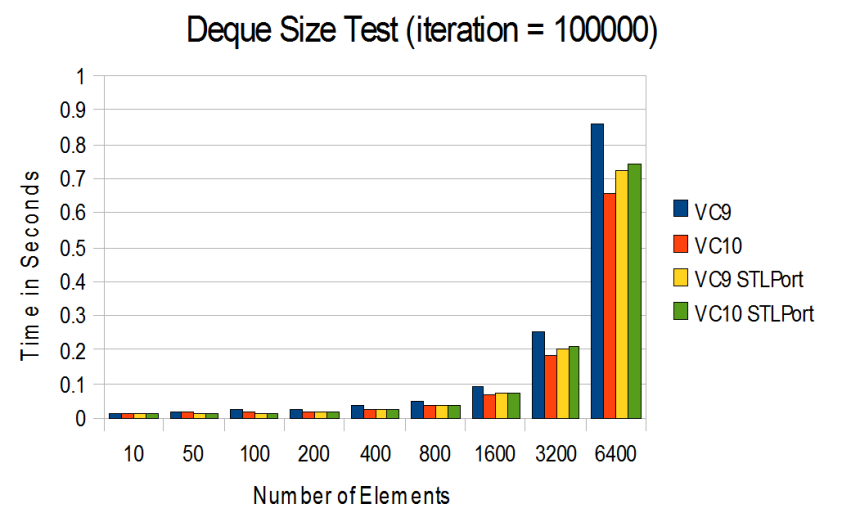
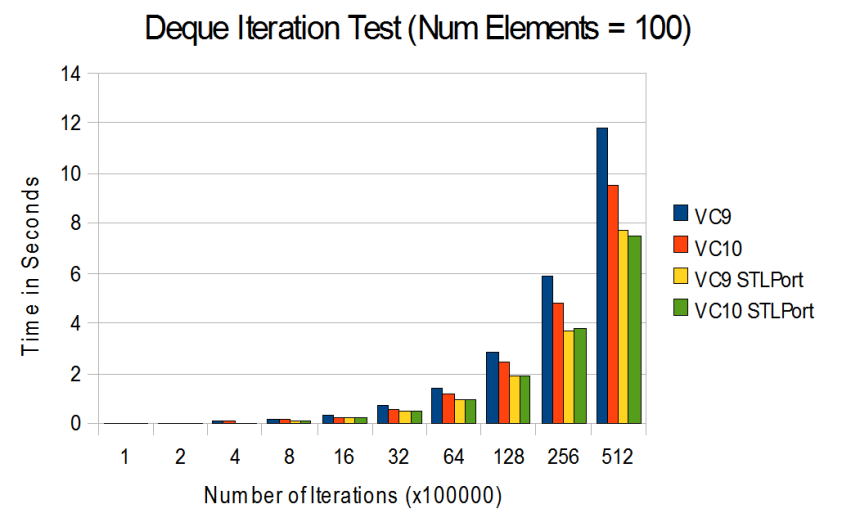
Recall: The stress test I wrote last year benchmark against 1. performance under growing container sizes, and 2. running a large number of operation while keeping container size a constant.

Recall:  The test for vector involves three operations – insertion, iterator traversal, and copy.

VC10 actually got a bit slower compare to VC9. Oops..

Performance of vector in STLPort is still leading by a mile.

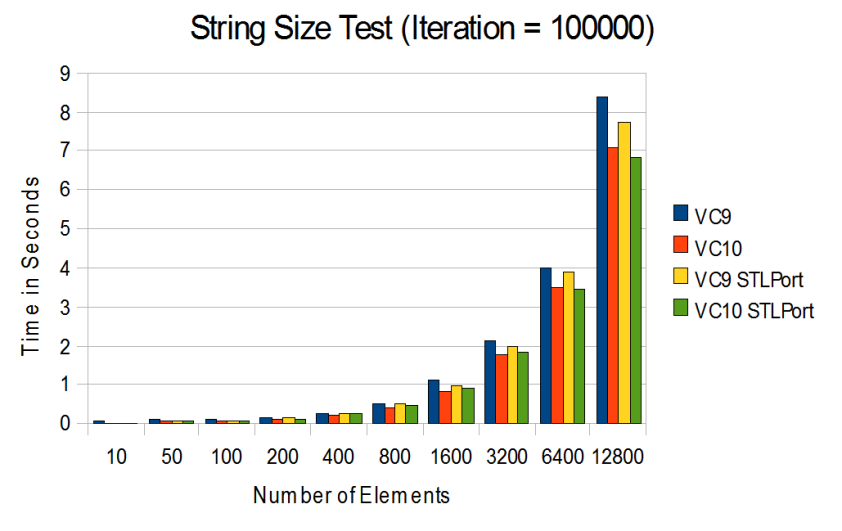
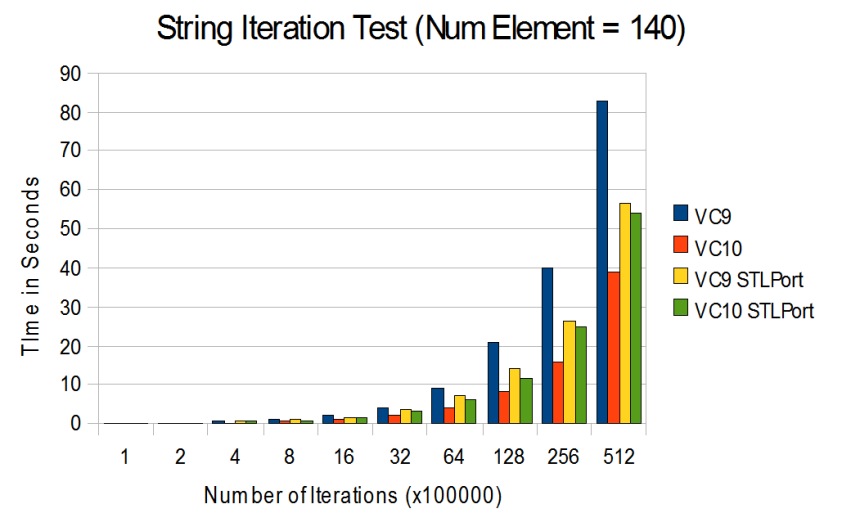
Recall: The test for string involves three operations – string copy, substring search, and concatenation.

VC10 is performing as well as STLPort in large strings.

VC10 small strings are now better optimized than STLPort. Very impressive!

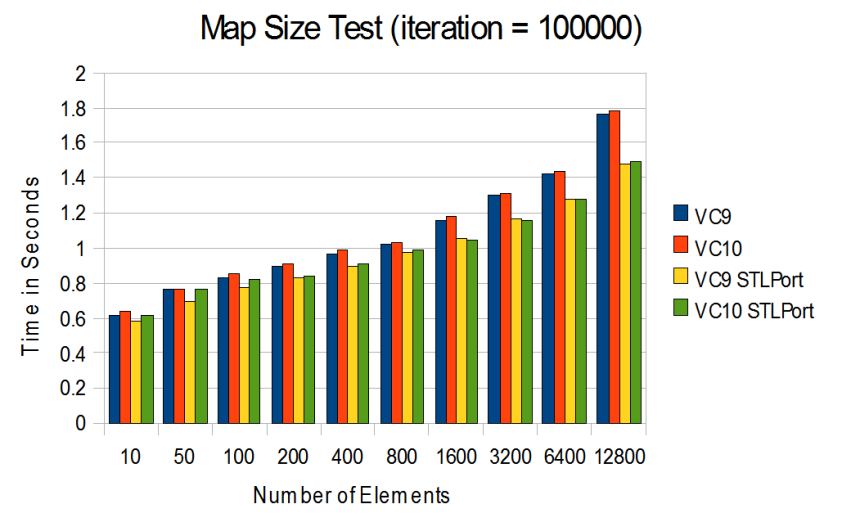
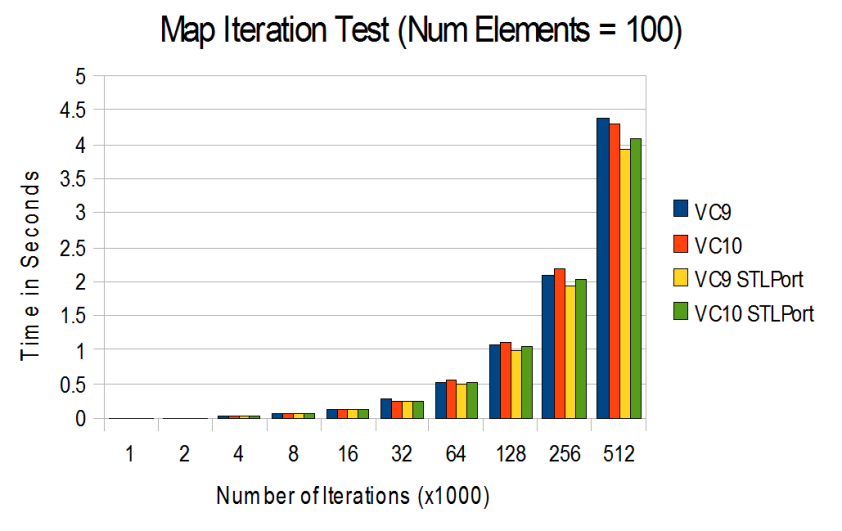
Recall: The test for map involves insertion, search, and deletion.

It appears that the performance of map in VC9 and VC10 are identical.

Same as above, nothing has changed here.

Recall: The test for Deque comes with a twist. The deque is implemented is as a priority queue through make_heap(), push_heap() and pop_heap(). Random items are inserted and removed from the queue upon each iteration.

VC10 is leading in the deque performance.

STLPort is still leading in small deque size. However, VC10 shows improvement against VC9.

Conclusion

STL implementation in VC10 definitely shows  some improvements over its predecessor. It has shrunk the gap against STLPort. But at the same time, it still have a bit more to go.

There is an average of 2.5% improvement comparing STLPort compiled with VC9 and STLPort compiled with VC10. So upgrading to VC10 will provide a performance gain even for those who don’t use STL.

I wasn’t disappointed or impressed by the improvements. So I guess it was within my expectations.

Source and data sheet can be downloaded here.

Tools: Visual Studio 2008 (VC9), Visual Studio 2010 (VC10), STLport 5.2.1

Machine Specification: Intel i5-750 with 4GB of RAM. Window 7.

A Fix for PuTTY’s Portfwd-Corrupt Bug

Update: July 26th 2011 Putty 0.61 has been released. My patch is incorporated in this release, and is listed as part of the release note.

From time to time, I would create a SOCKS proxy with SSH to secure my FTP or HTTP transfers. PuTTY is by far my favorite SSH client in Windows because it is free, lightweight, and supports advanced feature such as SSH connection over HTTP proxy.

Last week, when I was sending some data over to a FTP server through a PuTTY’s SOCKS proxy, I noticed something strange. Filezilla (FTP client ) indicated that all file transfers are 100% completed, yet the uploaded files were almost always incomplete. I retried the same upload numerous times, but would always result in almost completed file.

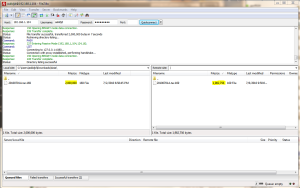
Here's the original file size and uploaded file size. Notice that they are not quite the same.

After trying different software combinations, I eventually figured out that the bug is originated from PuTTY. And some internet research shows that the bug has been around since 2003!

The Why and the How

I was bored, so I decided to download the source code of the PuTTY nightly snapshot and started a debug session. (Yes, real programmers debug FOSS after dinner for entertainment.)

Since I was completely new to the source code and SSH2 protocol, the bug certainly wasn’t obvious. I spent most of the first night setting up breakpoints and tracepoints to understand the logic path.

By the second night, I got a good handle on the way the sockets are created, and started reading the Connection Layer (RFC 4254) of the SSH2 protocol.

By the third night, I found the reason for the port-forwarding data corruption.

When PuTTY forwards a port, it sets up a TCP server at the local endpoint to receive the traffic, and then it sets up a TCP client to forward to traffic to the SSH server.

In terms of implementation, this is a three-step process for PuTTY.

1. PuTTY receives data from the local endpoint. In my case, it is Filezilla.

2. PuTTY buffers up the data in its own queue – the buffer chain.

3. Then PuTTY will send the data to the SSH server, with respect to the SSH2 sliding window protocol. The SSH2 window size is small – only 16 kB (no idea why). Therefore, PuTTY would often fill the window quickly, and buffer up the data in the buffer chain. The data will be only sent as soon as the SSH server opens up the window through a SSH2_MSG_CHANNEL_WINDOW_ADJUST message.

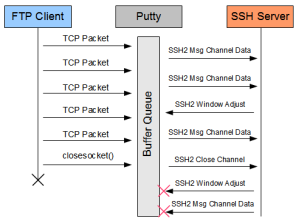
Unfortunately, step three has a bug.  When the local endpoint closes its connection to PuTTY, PuTTY would immediately close its channel to the SSH server without fully sending all its data. So the last set of channel adjustment message are ignored, and led to data being stuck in the buffer chain.

Because the channel is closed prematurely, the last set of window adjustment messages are ignored.

The Fix

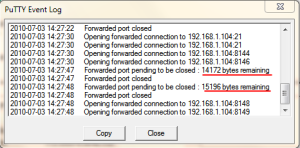
I modified PuTTY’s SSH2 channel closing sequence to keep the channel open until the buffer chain is completely emptied. For debugging, I also added some events in PuTTY’s event log to indicate the number of bytes PuTTY’s trying to send before closing the channel.

PuTTY event log to record the shut down scenario.

This modification works like a charm for me. I tested hundred of GB of small file uploads, and not a single file was corrupted.

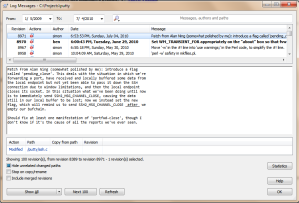
I submitted the patch to PuTTY development team, and it was accepted by Simon Tatham – the development lead.  The patch was checked into the PuTTY’s trunk directory as rev. 8971, and is built into the PuTTY nightly snapshot.

svn://svn.tartarus.org/sgt/putty rev. 8791

Final Thoughts

You can download my patch here if you are interested in the details.

PuTTY’s source code is clean and self explanatory. It is written by good programmers.

Now I have something to brag about in front of my nerdy co-workers and friends. 🙂

Using Visual Studio PGO as a Profiler

Last year, when our software was running into performance issue, I was desperately looking for a profiler for a large native C++ application. In the past, I’ve tried Rational Purify, and DevPartner and they just could not handle our application (or our machine could not handle the profiler).

So I came across Visual Studio’s Profile Guided Optimization (PGO). In a nutshell, VS compiler uses PGO to optimize the software based on real world scenario, as opposed to the traditional static file analysis. Like you would expect, it consists of three phases – Instrumentation, Training, and PG Optimization.

It turns out that PGO generates an useful profile data from the Training phase. With this profile data, PGO can be used as a lightweight native C++ profiler that provides pretty good code coverage.

The Instruction

PGO is supported from VC8.0 and up. I have tried it on VC9.0 and VC10.0, and the instructions were identical.

Assuming your software can be compiled with Visual Studio, and it is written in native C/C++.

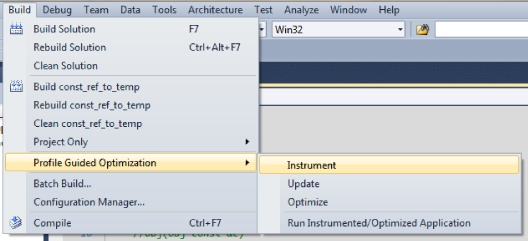
1. Click Build -> Profile Guided Optimization -> Instrument.

2. Click Build -> Profile Guided Optimization -> Run Instrumented/Optimization Application. You will need to exercise the region of the software that you would like to profile. The longer you run it, the more accurate the profile data would be as it averages out the startup overhead.

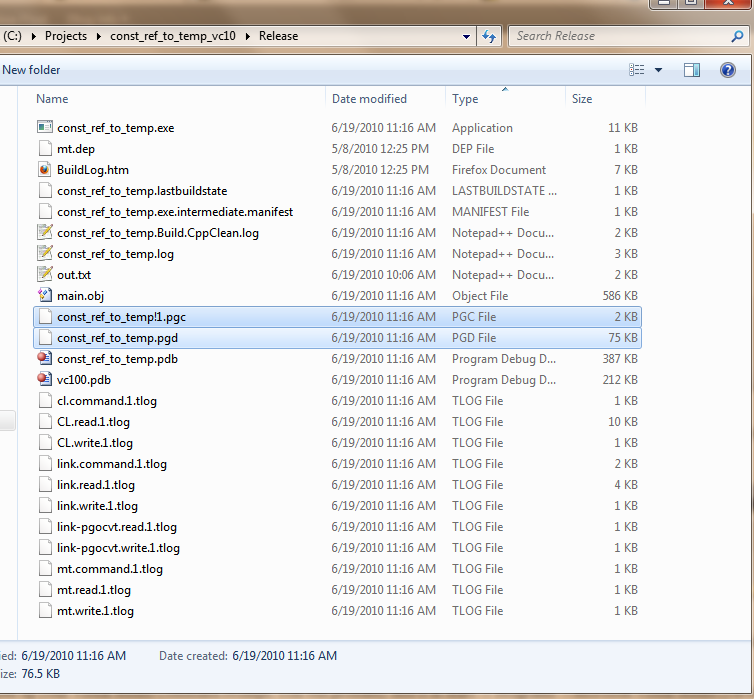
3. Exit your software. In the folder of your executable (release folder), you should see a xxx.pgd file, and a xxx.pgc file. The pgd file is your profile database that holds all your methods, and the pgc file is the profiling data recorded during the software run.

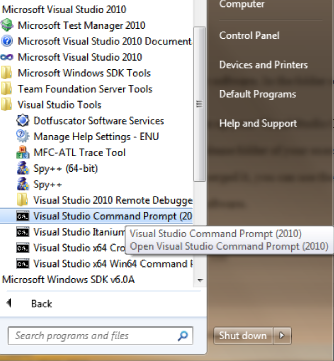
4. Now open up your Visual Studio Command Prompt. You will probably find it in Start -> Programs ->Microsoft Visual Studio (version) ->Visual Studio Tools.

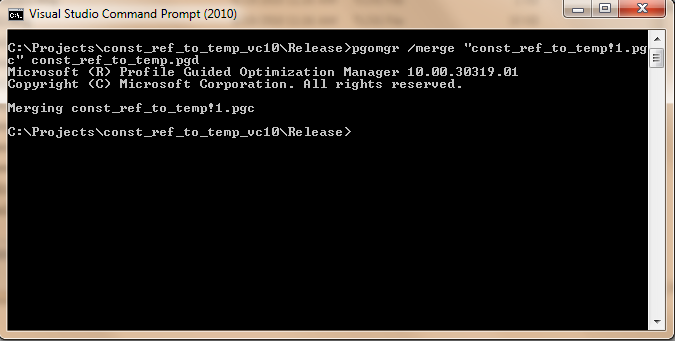
5. Go to the release folder of your executable. In this step, you need to merge the software run with the profile database. Type pgomgr /merge xxx.pgc xxx.pgd.

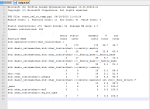
6. Once you merged it, you can use the pgomgr to generate a summary of your software run. To do this, type pgomgr /summary xxx.pgd. I recommend piping to output to a text file.

7. The summary file should include the code coverage analysis from your software run.

The summary provides a simple, yet very powerful data on the behavior of your software. It gives you an idea where the hotspots are, and what to optimize.

To find out more about the summary (including the /detail summary), see Kang Su’s blog on “Cracking Profile-Guided Optimization profile data with PGOMGR

Thoughts

Keep in mind that the optimization level of the instrumented build is toned down dramatically. Therefore, the results might not reflect the actual performance in the release build.

In my experience, the instrumented build runs faster than a debug build.

PGO can only instrument DLL and executable. It can not instrument static library.

I have attempted to used PGO to optimize our software. It didn’t turn out too well. Either my machine ran out of memory (4 GB), or the PGO’ed executable didn’t behave properly.