Start Using Unordered Map

For years, STL Map is the premium container choice for C++ programmers for fast data insertion, look-up and removal.

It uses a red-black tree, has elegant logarithmic properties, and guarantees to be balanced.

Therefore, Map is used very often in our product. Almost too often…

In TR1, Unordered Map has long been proposed. Boost has a cross platform implementation. VC9.0 also support the TR1 namespace.

It provides a powerful alternative to C++ programmers.

Penalty of Sorting

Besides fast data operation, Map also provides data sorting. As a refresher for data structure 101, a balanced binary tree will provide O(log n) for add/remove/search operations. In the case of red-black tree, it guarantees that the longest branch will not be 2x longer than the shortest branch. So, it is mostly balanced, but some operations can be somewhat longer than others.

But what if sorting is not necessary? Why would we heapify the whole tree on every add/remove operation? Can we do better than O(log n)?

TR1 Unordered Map is designed to tackle this problem.

C++ Hash Table

Most modern programming languages comes with some standard hash tables. For C++, well, it is still in a “draft” called technical report 1. As usual, the C++ standard committee spends most of its time on metaprogramming stuff, and neglect the simple and useful stuff.

The bottom line is that Unordered Map is the C++ hash table.  It’s interface is very similar to Map. In fact, if sorting is not a requirement, simply changing your container map to unordered_map will be enough.

Unordered Map Could Be Right for You

Unordered Map offers O(1) for add/remove/search operations, assuming that the items are sparsely distributed among the buckets. In worst case, all items are hashed to the same bucket, and all operation becomes linear.

The worst case doesn’t happen often if the hash function is doing its job. If sorting is unnecessary, unordered map is faster than map.

But talk is cheap, let’s see some benchmark.

Speed Benchmark

To test the containers, we insert a set of uniformly distributed random numbers into each container, and then one by one find the inserted numbers.

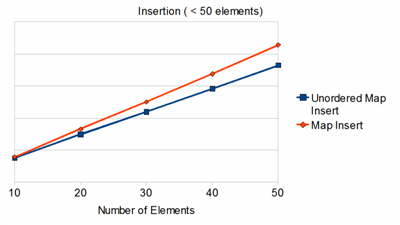
First, let’s test the performance of small container size under 50 elements. This is to find out if either of the container has any overhead associated for initialization.

insert_50_element_small

For small container size, unordered_map is slightly faster than map

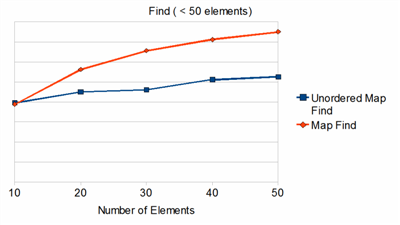
find_50_element_small

Map search shows a nice O(log n) growth. Unordered_map grows much slower than logarithmic.

Next, we can try a much large data set to see how the container handle itself.
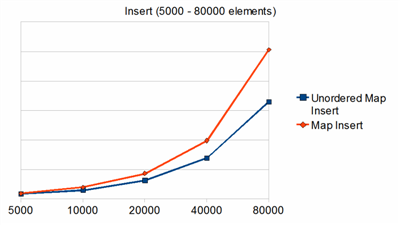
insert_many_element_small

Again, unordered_map insertion grows slower than map

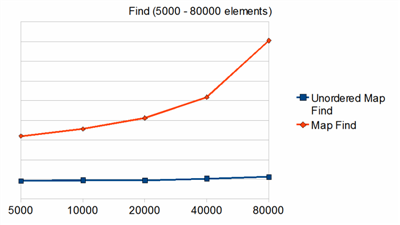
find_many_element_small

This is the penalty of sorting. Unordered_map runs at O(1), and it is unaffected the number of elements when the hash function is doing its job.

You can see that the search operation in Unordered_map is blazing fast. But hash tables are more than meets the eyes; the devil is in the details. We need further analysis before jumping into conclusions.

Looking A Bit Deeper

Unlike a balanced tree structure, hash table are somewhat unpredictable in nature. If the hash function is poorly suited for the given data set, it would backfire and result in linear runtime. Because of this nasty behavior, some programmers would even avoid hash table altogether.

There are numerous algorithm to optimize a hash table to avoid the worst case. In Unordered_map, there are two critical factors to consider- the max load factor and the hash function.

According to C++ TR1, the max load factor for Unordered_map should be 1.0. So if the average bucket size is greater than 1, rehashing would occur. VC 9.0 didn’t follow the standard, and uses 4.0 as the default load factor.

When Unordered_map grows beyond the allowed load factor, the number of buckets will change. In Boost, the programmer decided to increase the number of buckets by a prime number. In VC 9.0, the bucket size increases by a factor of 8 on each rehash.

For hash function, we can look at the integer hash function. Boost unordered_map follows closely with Peter Dimov’s proposal on Section 6.18 of the TR1 issue list. The hash function is defined as

for(unsigned int i = length * size_t_bits; i > 0; i -= size_t_bits)
{
seed ^= (std::size_t) (positive >> i) + (seed<<6) + (seed>>2);
}
seed ^= (std::size_t) val + (seed<<6) + (seed>>2);

VC90 uses a variant of LCG, the Park-Miller random number generator.

Trying for the Worst Case

Now that we know a bit more of implementation details, let’s see how bad the worst case is.

To do this, we can try to hash 1,000,000 random numbers. Unlike before, the random number will be generated from a non-uniform distribution – Gamma, Exponential, and Geometric. I particularly enjoy Gamma distribution because its shape can easily be skewed with shape and scale parameters.

There are two questions to find out from this test.

1. What is the maximum number of items hashed into a single bucket? In other word, what’s the worst case like?

2. Did the load factor of 1 cause more re-hashing? As we know, rehashing is very expensive and should be done the least possible.

Let’s see some results!
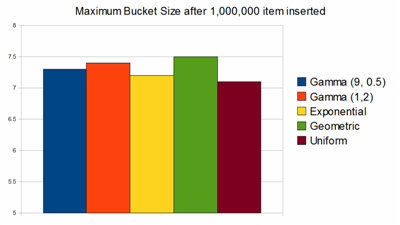
max_bucket_size_small

After 1,000,000 items inserted, it appears that the skewed data sample makes little difference to hash function.

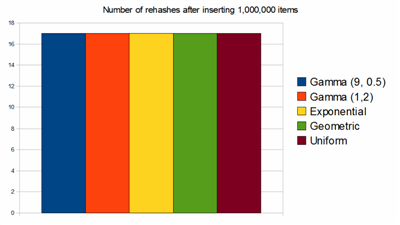
number_of_rehashes_small

The number of rehashes is 17 across all distributions.

Okay, I failed miserably in my attempt for the worst case. Choosing a skewed distribution only made a slight dent to the hash table. On average, the most overloaded bucket after 1,000,000 only has 7 items in there. In a balanced tree, O(log2(1,000,000) = 20. The hash function is definitely doing its job.

Conclusion

If sorting is unnecessary, Unordered_map provides a nice alternative to Map. If the container doesn’t change often, the performance gain with Unordered_map is even greater.

Don’t worry too much about the worst case of a hash table. The Boost implementation is rock-solid.

Avoid the VC9.0 TR1 Unordered_map because it does not follow standard. It is also a bit slower in comparison to Boost.

Pitfalls

The focus of this article is on speed. It is also necessary to compare the memory usage between Map and Unordered Map. I did some primitive testing and did not see a difference. But before jumping into conclusion, I need more time to think about the test setup. I will get to that when I get more time.

Source

The source and the spreadsheets can be downloaded here.

Tools: Visual Studio 2008, Boost 1.39, Window XP SP3
Some Relief in Debugging Boost Functions

F11 Hell

F11 F11 F11 F11 F11 F11 F11 F11 F11 F11 F11 F11 F11 F11 F11 F11 F11 F11 F11 F11 F11 F11 F11 F11 F11 F11 F11 F11 F11 F11. Finally!!

That’s the pain of debugging a boost::function in Visual Studio.

Consider the following code:

class CTest { public: void func(int i) {return 0;} }
boost::function f = boost::bind(&CTest::func, &t, _1);
f(1);

To step into the target function f, it requires 30 F11 keystrokes. Since our product uses (or overuses) boost::function, debugging can be a nightmare.

Counter the Counter Arguments

Before I get too far, let’s answer some counter arguments.

1. Who presses F11 30 times? I know exactly what to step over, so I perform combination of F10 and F11 to navigate my way through.

Answer: The exact F10/F11 combination is tricky. There are countless times that I over-pressed F10, skipped over the crucial functions.

2. There isn’t that much code to step through.

Answer: If I have to step into 5 boost functions, that’s 30 *5 = 150 F11’s. If I debug this code 30 times a day, that’s 150 * 30 = 4500 keystrokes.

Just admit it. Debugging boost::function with Visual Studio sucks.

Some Relief

In Visual Studio, there is a hidden feature that allows you to step over certain functions. Basically, it is a bunch of regular expressions that the debugger looks into. If the function signature matches the specified string, the debugger can either step into or step over the matched function.

So I spent some time crafting some regular expression to relief the pain of boost functions. It will bring down the number of F11 from 30 to 16. It’s not a complete solution, but it does help tremendously.

Add the following four keys to [HKEY_LOCAL_MACHINE\SOFTWARE\Microsoft\VisualStudio\9.0\NativeDE\StepOver]

boost_function_step_into = boost\:\:_bi\:\:list[0-9]\<boost\:\:_bi\:\:value.*=StepInto
boost_function_list_no_step_into = boost\:\:_bi\:\:list[0-9].*
boost_function_function_base_no_step_into = boost\:\:function_base\:\:.*
boost_function_unwrapper_no_step_into = boost\:\:_bi\:\:unwrapper.*

More Information

I have tested this on Boost library version 1.36, 1.37 and 1.39.

The .reg file that automatically updates your Visual Studio 9.0 path can be downloaded here.

For older Visual Studio, this trick also work. Click here for the registry location.

STL Performance Comparison: VC71, VC90, and STLport

A Programmer’s Hunch

The product I work on has been migrated from VC71 to VC90. Ever since the upgrade, I feel that the software is taking longer to start up, has become less responsive. I have been working on the software for several years, so I have certain performance expectations . My programmer’s hunch tells me that something just isn’t right.

I did some searches, and found out that Checked Iterator (Secure SCL) for STL has been turned on since VC80. It is enabled by default for Debug and Release build. There are numerous performance complains for VC80 STL implementation. Our product relies extensively on STL, so that could certainly be a contributing factor to the sluggishness.

Time to Test

To see the current state of the system, I wanted to see the performance between VC71 and VC90 with Checked Iterator. I also wanted the difference without Checked Iterator. Lastly, I threw in STLport into the pot, just because I found a blog that says it is the fastest.

Four-Way Comparison

In the test, I chose four commonly used containers in our software – vector, string, map and deque. For each container type, it will be run against two types of test – Iteration and Size. For the iteration test, the container will be benchmarked with a fixed size across a large number of iterations. For the size test, the size of the container grows while the number of iteration remains the same.

Comparison – Vector

The test for vector involves three operations – inseration, iterator traversal, and copy.

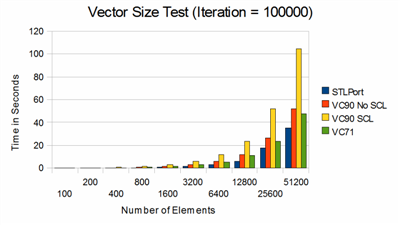
Vector Size Test (Iteration = 100000)

VC90 with Checked Iterator runs much slower.

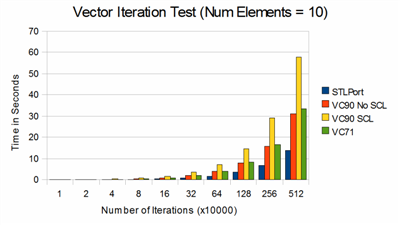
Vector Iteration Test (Num Elements = 10)

Without Checked Iterator, much of the lost performance are regained.

From VC71 to VC90 with SCL, there are 70% – 100% decrease in performance. By turning off Checked Iterator, the performance of VC90 is roughly equivalent to VC71. STLport outperforms all versions of Visual Studio.

Comparison – String

The test for string involves three operations – string copy, substring search, and concatenation.

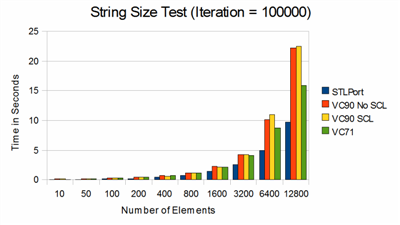
string_size_small

VC90 performed poorly compare to VC71, regardless of Checked Iterators.

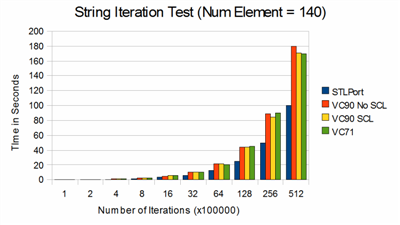
string_iter_small

STLport smoked its competitions in the short string test. (Note: 140 is the maximum character in a Twitter post)

Performance of string in VC90 degrades rapidly as the string grows. It appears that the Checked Iterator feature does not impact the performance of string.[Update: Secure SCL and HID was not turned off in string.  See article.] Again, STLport outperforms all version of Visual Studios. This is likely because of the optimization from Short String Optimization and Template Expression for string concatenation.

Comparison – Map

The test for map involves insertion, search, and deletion.

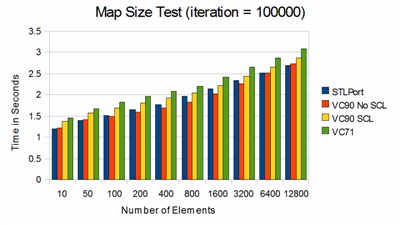
map_size_small

Minor improvement in VC9 compare to VC71.

map_iter_small

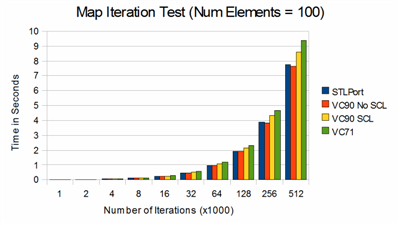
VC90 without Checked Iterator came out slightly ahead.

Surprisingly, the performance came out roughly the same for all, with VC71 to be the slowest.

Comparison – Deque

The test for Deque comes with a twist. The deque is implemented is as a priority queue through make_heap(), push_heap() and pop_heap(). Random items are inserted and removed from the queue upon each iteration.

deque_size_small

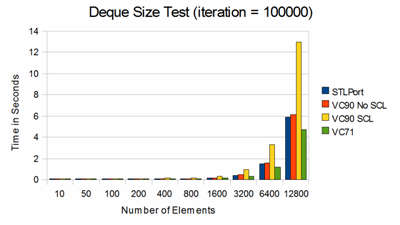
As the deque grows, VC90 with Checked Iterator runs at snail pace.

deque_iter_small

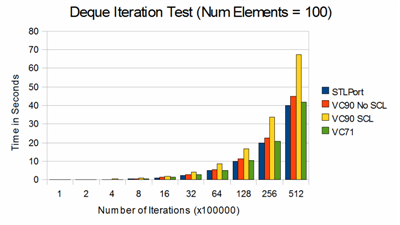
VC71 and STLport came out fastest.

The performance for VC90 with Checked Iterator is quite disappointing compare to others.

So.. Now What?

VC90 with Checked Iterator is indeed very slow. Although I see the benefit of iterator validation during debug phase, I fail to understand why it is enabled in release build. I am not convinced by the argument of correctness over performance. Once the iterators are proven correct, Checked Iterator is simply a burden. When the software is in customers’ hand, all these validations are pointless.

On a side note, the string and vector performance of STLport is very impressive. It is more 2x faster than Visual Studio. It’s simply amazing.

Source

The source and the results can be downloaded here.

Tools: Visual Studio 2003, Visual Studio 2008, STLport 5.2.1 (with Visual Studio 2008)

Machine Specification: Core Duo T2300 1.66 GHz with 2GB of RAM. Window XP SP3.

Low-Fragmentation Heap (LFH) Analysis


Recently, I read a MSDN article that describes Low-Fragmentation Heap (LFH).

Applications that benefit most from the LFH are multi-threaded applications that allocate memory frequently and use a variety of allocation sizes under 16 KB. However, not all applications benefit from the LFH. To assess the effects of enabling the LFH in your application, use performance profiling data. … To enable the LFH for a heap, use the  GetProcessHeap function to obtain a handle to the default heap of the calling process, or use the handle to a private heap created by the  HeapCreate function. Then call the HeapSetInformation function with the handle.


Alright, that sounds great, but what does LFH really improve, when do these improvements kick in and what are the side effects?  I found some related articles on the internet, but they don’t really answer my questions. I guess it is time to do some experiment.


Test Program

Since LFH addresses heap fragmentation, the first task obviously is to create a scenario where the heap is fragmented. Heap fragmentation occurs when lots of memory are allocated and deallocated frequently in different sizes. So I wrote a test program to do the following:

  1. The program runs in many iterations.
  2. At each iteration, it randomly allocates or deallocates one chunk of memory.
  3. The size of the memory chunk allocated is randomly chosen from a list of 169, 251, 577, 1009, 4127, 19139, 49069, 499033 and 999113 bytes. I chose prime numbers for fun.
  4. Okay, I lied about item #3. It is not truly random. There will only be fixed number of each memory type, and the total number of chunks allocated will be fixed. Otherwise my computer could run out of memory.

I ran the program with the default allocator and LFH. Here’s the result from the test program.

Memory Overhead

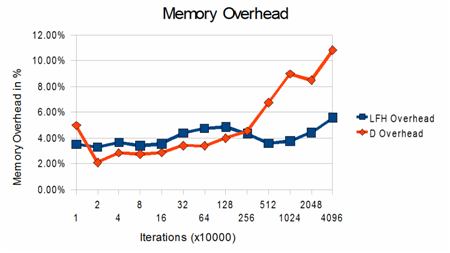
Memory overhead is the difference between the memory the program would like to allocated and the memory the OS actually allocated. In theory, heap fragmentation can cause the heap to grow larger than it needs to be. The first graph shows that in the earlier iterations, LFH utilizes more memory up front, but after 25600000 iterations, the heap is probably fragmented enough that the memory overhead increases significantly for the default allocator.

Memory Overhead

The amount of additional memory utilized as a percentage of the total usage.

Page Faults

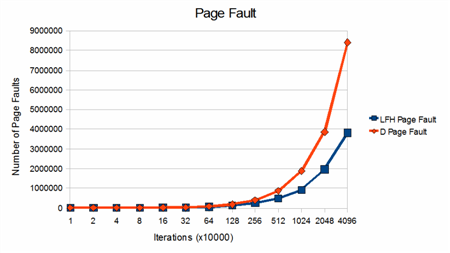
The second graph shows the number of page faults occurred. LFH seems to generate far less page faults than the default allocation policy. To be honest, I am not sure if this is a bad thing since the page fault could be soft page faults (minor fault).

Page Fault

The number of page faults generated between LFH and default allocation policy.


Speed

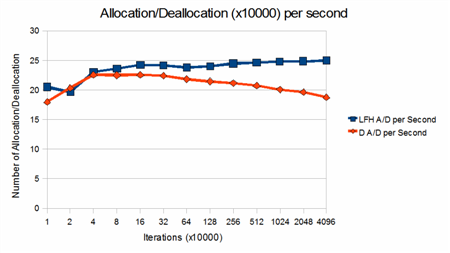
The third graph shows the speed between LFH and the default allocation policy. LFH is consistently faster than the default allocation policy in the number of allocation and deallocation performed per second. As the number of iteration increases, there are significant performance degradation from the default allocator.

The number of allocation and deallocation performed per second

The number of allocation and deallocation performed per second between LFH and the default allocation policy

Conclusion

There are little doubt that the performance of LFH is superior than the default allocation policy in the test program. But whether to not to enable LFH should be determined case by case. Programs that only runs for a short period of time will use more memory in LFH, and will not have much to gain.

Pitfalls

The test program run in a single thread. According to the MSDN documentation, multi-threaded program can be benefited by the LFH. So this analysis is not complete. I will update it when I have more time.

[Update 2011/03/22: 18 months later, I finally got around that test this under a multi-threaded program. See Heap Performance Counter for the result.]

Source

The source and the spreadsheet can be downloaded here.

Compiler: Visual Studio 2008

Machine Specification: Core Duo T2300 1.66 GHz with 2GB of RAM.