Recently, I read a MSDN article that describes Low-Fragmentation Heap (LFH).
Applications that benefit most from the LFH are multi-threaded applications that allocate memory frequently and use a variety of allocation sizes under 16 KB. However, not all applications benefit from the LFH. To assess the effects of enabling the LFH in your application, use performance profiling data. … To enable the LFH for a heap, use the GetProcessHeap function to obtain a handle to the default heap of the calling process, or use the handle to a private heap created by the HeapCreate function. Then call the HeapSetInformation function with the handle.
Alright, that sounds great, but what does LFH really improve, when do these improvements kick in and what are the side effects? I found some related articles on the internet, but they don’t really answer my questions. I guess it is time to do some experiment.
Test Program
Since LFH addresses heap fragmentation, the first task obviously is to create a scenario where the heap is fragmented. Heap fragmentation occurs when lots of memory are allocated and deallocated frequently in different sizes. So I wrote a test program to do the following:
- The program runs in many iterations.
- At each iteration, it randomly allocates or deallocates one chunk of memory.
- The size of the memory chunk allocated is randomly chosen from a list of 169, 251, 577, 1009, 4127, 19139, 49069, 499033 and 999113 bytes. I chose prime numbers for fun.
- Okay, I lied about item #3. It is not truly random. There will only be fixed number of each memory type, and the total number of chunks allocated will be fixed. Otherwise my computer could run out of memory.
I ran the program with the default allocator and LFH. Here’s the result from the test program.
Memory Overhead
Memory overhead is the difference between the memory the program would like to allocated and the memory the OS actually allocated. In theory, heap fragmentation can cause the heap to grow larger than it needs to be. The first graph shows that in the earlier iterations, LFH utilizes more memory up front, but after 25600000 iterations, the heap is probably fragmented enough that the memory overhead increases significantly for the default allocator.

The amount of additional memory utilized as a percentage of the total usage.
Page Faults
The second graph shows the number of page faults occurred. LFH seems to generate far less page faults than the default allocation policy. To be honest, I am not sure if this is a bad thing since the page fault could be soft page faults (minor fault).

The number of page faults generated between LFH and default allocation policy.
Speed
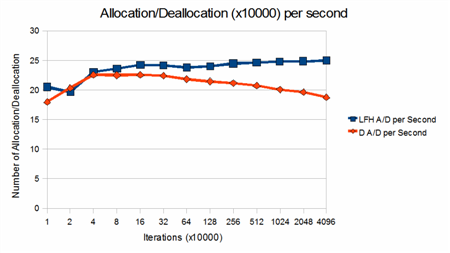
The third graph shows the speed between LFH and the default allocation policy. LFH is consistently faster than the default allocation policy in the number of allocation and deallocation performed per second. As the number of iteration increases, there are significant performance degradation from the default allocator.

The number of allocation and deallocation performed per second between LFH and the default allocation policy
Conclusion
There are little doubt that the performance of LFH is superior than the default allocation policy in the test program. But whether to not to enable LFH should be determined case by case. Programs that only runs for a short period of time will use more memory in LFH, and will not have much to gain.
Pitfalls
The test program run in a single thread. According to the MSDN documentation, multi-threaded program can be benefited by the LFH. So this analysis is not complete. I will update it when I have more time.
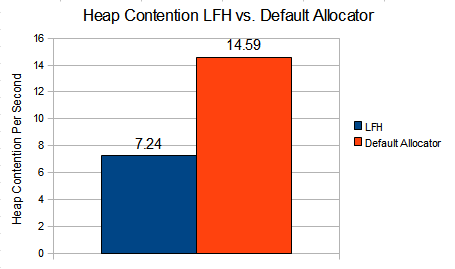
[Update 2011/03/22: 18 months later, I finally got around that test this under a multi-threaded program. See Heap Performance Counter for the result.]
Source
The source and the spreadsheet can be downloaded here.
Compiler: Visual Studio 2008
Machine Specification: Core Duo T2300 1.66 GHz with 2GB of RAM.


