Last year, when our software was running into performance issue, I was desperately looking for a profiler for a large native C++ application. In the past, I’ve tried Rational Purify, and DevPartner and they just could not handle our application (or our machine could not handle the profiler).
So I came across Visual Studio’s Profile Guided Optimization (PGO). In a nutshell, VS compiler uses PGO to optimize the software based on real world scenario, as opposed to the traditional static file analysis. Like you would expect, it consists of three phases – Instrumentation, Training, and PG Optimization.
It turns out that PGO generates an useful profile data from the Training phase. With this profile data, PGO can be used as a lightweight native C++ profiler that provides pretty good code coverage.
The Instruction
PGO is supported from VC8.0 and up. I have tried it on VC9.0 and VC10.0, and the instructions were identical.
Assuming your software can be compiled with Visual Studio, and it is written in native C/C++.
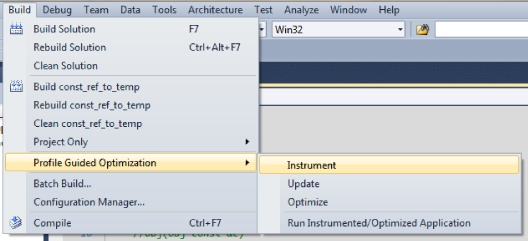
1. Click Build -> Profile Guided Optimization -> Instrument.
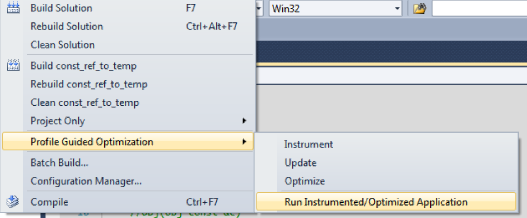
2. Click Build -> Profile Guided Optimization -> Run Instrumented/Optimization Application. You will need to exercise the region of the software that you would like to profile. The longer you run it, the more accurate the profile data would be as it averages out the startup overhead.
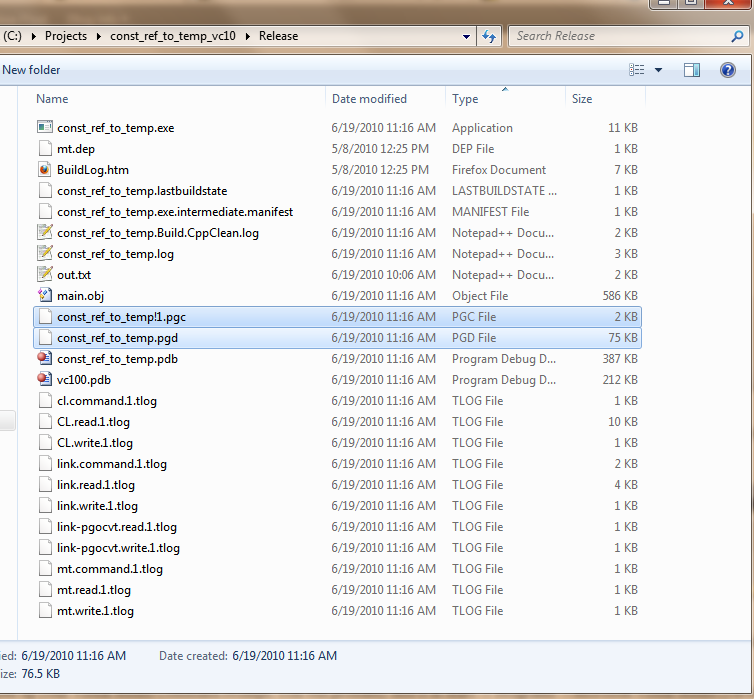
3. Exit your software. In the folder of your executable (release folder), you should see a xxx.pgd file, and a xxx.pgc file. The pgd file is your profile database that holds all your methods, and the pgc file is the profiling data recorded during the software run.
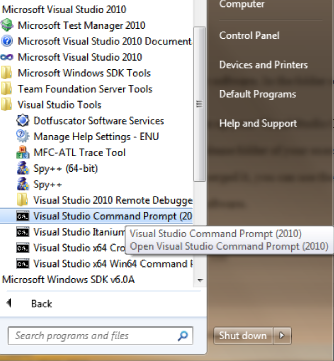
4. Now open up your Visual Studio Command Prompt. You will probably find it in Start -> Programs ->Microsoft Visual Studio (version) ->Visual Studio Tools.
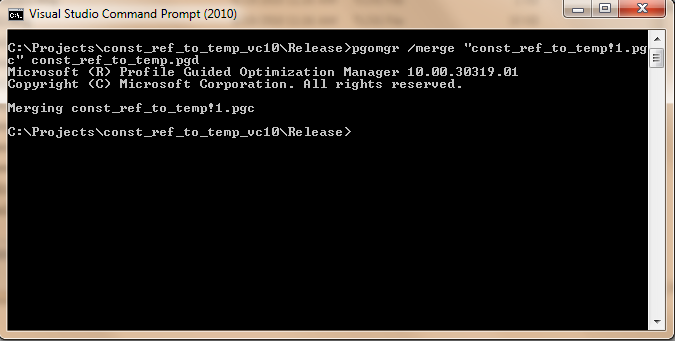
5. Go to the release folder of your executable. In this step, you need to merge the software run with the profile database. Type pgomgr /merge xxx.pgc xxx.pgd.
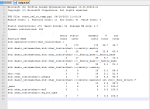
6. Once you merged it, you can use the pgomgr to generate a summary of your software run. To do this, type pgomgr /summary xxx.pgd. I recommend piping to output to a text file.
7. The summary file should include the code coverage analysis from your software run.
The summary provides a simple, yet very powerful data on the behavior of your software. It gives you an idea where the hotspots are, and what to optimize.
To find out more about the summary (including the /detail summary), see Kang Su’s blog on “Cracking Profile-Guided Optimization profile data with PGOMGR”
Thoughts
Keep in mind that the optimization level of the instrumented build is toned down dramatically. Therefore, the results might not reflect the actual performance in the release build.
In my experience, the instrumented build runs faster than a debug build.
PGO can only instrument DLL and executable. It can not instrument static library.
I have attempted to used PGO to optimize our software. It didn’t turn out too well. Either my machine ran out of memory (4 GB), or the PGO’ed executable didn’t behave properly.
