As a side project, I have been developing an application to monitor the performance of our main product (hence the lack of update). In my experience, our large C++ programs have not worked well under most profilers (either too slow, or too resource intensive). The PGO technique I posted last year works well within the scope of a library, but does not provide performance data in a system wide perspective. ProcExp from SysInternal provides good performance insights with threads CPU cycles and context switches, but the results are not recordable. So I started by duplicating ProcExp’s thread performance output through GetThreadTimes.
Plotting The Data
GetThreadTimes is a very powerful function that provides the cumulative CPU and kernel time consumed by a particular thread. The resolution is known to be coarse, and has a tendency to overlook very short execution (e.g. thread that couldn’t fully consume its quantum). A post online noticed the granularity of measurement, and suggested a 1 second sampling time to get sufficiently accurate result.
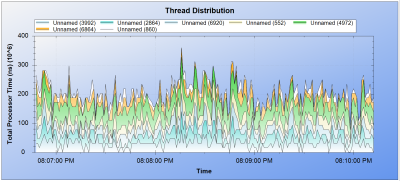
Below is a timing report from GetThreadTimes sampling once a second. The target application is Media Player Classic playing a 720p H.264 video.
Sadly, the plot is almost completely indecipherable. There are large fluctuations from reading to reading, and thread times collected are occasionally zero.
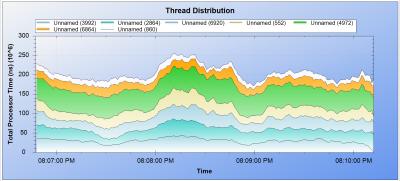
So I spent a lot of time optimizing the data. After many trials and errors, I finally decided to smooth on the data points with a 15 second rolling average. The resulting plot looks far more consumable.
Final Thoughts
After digging into Windows Internal, I still couldn’t grasp the output of GetThreadTimes. Without averaging, the data is extremely difficult to consume.
By smoothing out the data with a rolling average, the data plot became very practical. In fact, this method has already uncovered a performance bug during overnight runs.


Do you have any plans to make the source for this tool available?
What do you use to do the plotting?
I think I could use something similar to profile my server systems.